
APIs: Evaluating Supply and Demand
Trends and Factors that Shape the Market for Active Pharmaceutical Ingredients
-
 (c) monticello/Shutterstock
 -
 Patricia Van Arnum, DCAT Value Chain Insights
 -
 “Overall pharmaceutical industry growth is expected to be approximately 6%.” Kate Kuhrt, Clarivate Analytics
 -
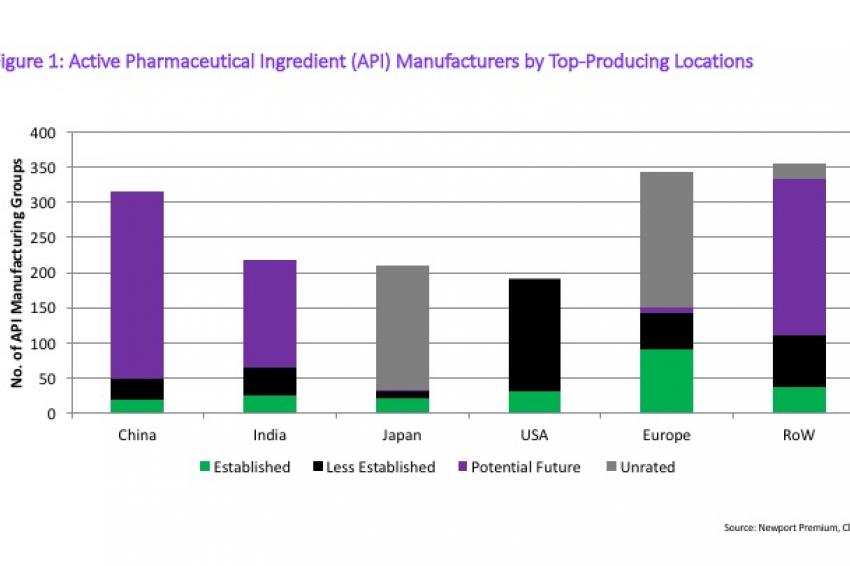 Figure 1
 -
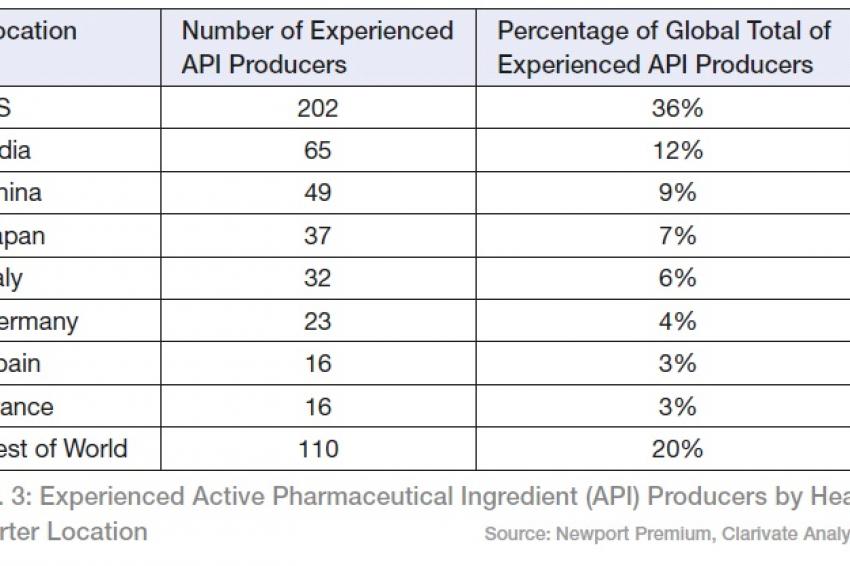 Tab. 3
 -
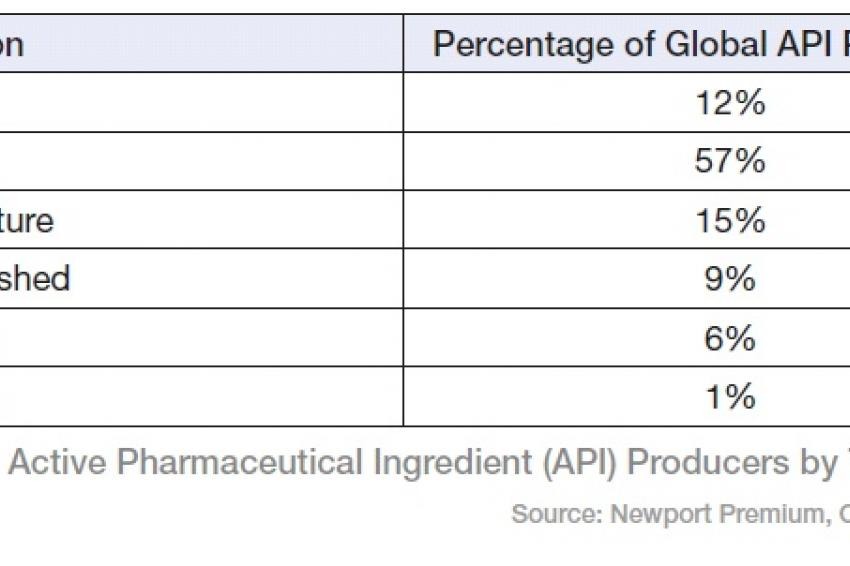 Tab. 2
 -
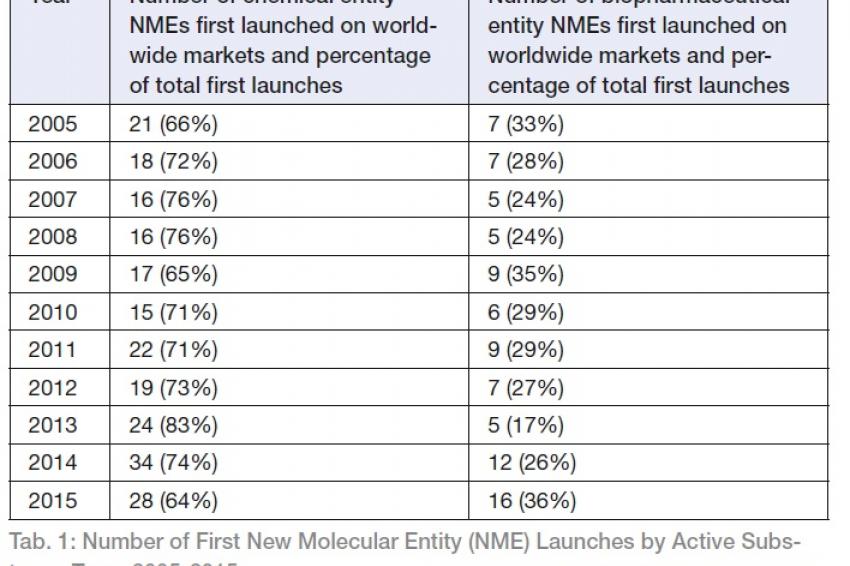 Tab. 1
The market for active pharmaceutical ingredients (APIs) is approximately $140 billion and is projected to reach nearly $190 billion by 2020. So what does the market show?
The API market is roughly divided: 60% for the captive market (produced internally by pharmaceutical companies) and 40% for the merchant market (produced by third-party providers for a pharmaceutical company). On a geographic basis, Western Europe and the US lead in terms of experienced API producers. What are the factors influencing API supply and demand?
APIs: the Demand Side
Demand for APIs is influenced by a variety of factors, including overall pharmaceutical industry growth, product demand for therapeutic areas, and financing trends, particularly for smaller pharmaceutical companies, noted Kate Kuhrt, head of Go-to-Market for the Life Sciences business at Clarivate Analytics, a provider of insights and analytics. Kuhrt spoke at DCAT Sharp Sourcing, a one-day conference for sourcing, procurement and supply management executives and suppliers, organized by the Drug, Chemical & Associated Technologies Association (DCAT).
On the demand side, Kuhrt points to several favorable indicators. Overall pharmaceutical industry growth is expected to be approximately 6%, according to information from the 2016 CMR Factbook from Clarivate Analytics. This estimate is compatible with other industry estimates. A December 2016 analysis by QuintilesIMS forecasts that total spending on medicines is expected to reach $1.5 trillion by 2021 and will increase at a 4-7% compound annual growth rate through 2021, which is down from the nearly 9% growth level seen in 2014 and 2015. (Note: Spending is measured at the ex-manufacturer level before adjusting for rebates, discounts, taxes and other adjustments that affect net sales received by manufacturers.) The impact of these factors is estimated to reduce growth by $127 billion, or approximately 35% of the growth forecast through 2021.
In looking at new global product launches, small molecules, or new chemical entities, still dominate APIs, but the share of biologic-based new molecular entities (NMEs) is increasing with ranges from approximately one quarter to one-third of new NMEs launched on a global basis (tab. 1).
Another important trend relates to research and development (R&D) spending by molecular type. Kuhrt pointed out that the amount of R&D spending is nearly evenly divided between small molecules (52.3% in 2015) and biologics (47.7% in 2015).
On a therapeutic basis, oncology/immuno-modulators represent the leading class both in terms of global new product launches and R&D spending. Anti-cancer/immuno-modulators accounted for 30% of first NME launches in 2015 and 28% of global R&D spending, according to the 2016 CMR Factbook. Alimentary and metabolism was the next leading therapeutic area, representing 20% of new global NME launches in 2015 and 10.4% of R&D spending.
In terms of global product launches for NMEs, the major pharmaceutical companies account for the large amount of launches although mid-tier and other companies play a significant role. In looking at first NME global product launches from 2010–2015, the major pharmaceutical companies led in 2011 (17 or 55% of new NME launches), 2013 (16 or 55%), 2014 (26 or 57%), and 2015 (25 or 57%). Mid-tier and other companies led in 2010 (14 or 66% of new NME launches) and 2012 (14 or 54%), according to information from Clarivate Analytics.
Financing trends are an important measure of the health of smaller pharmaceutical companies, particularly in private financing needed to fund pipelines and operations. In 2016, the pharmaceutical industry as a whole tallied $38 billion from public and private financing, according to BioWorld, part of Clarivate Analytics. At DCAT Sharp Sourcing, Kuhrt pointed out that only 24% of this funding was from private financing, and public financing accounted for 56% of this total.
“We saw in 2016 that more deals are being made outside the US,” said Kuhrt in further breaking down trends in private financing. Citing analysis carried out by BioWorld, Kuhrt explained that there was an increase in the number of European companies attracting venture capital. “Also, we are seeing that China is witnessing a greater involvement by private-equity investors with close ties to the Chinese government in biotech innovation,” she said. "It is also worth noting that there are an increasing number of deals being concluded by Canadian biopharmas, with five private companies receiving venture backing in 2016.” Overall, BioWorld reported the US led in private financing in 2016 with $5.77 billion raised, followed by Europe ($1.43 billion), Asia/Australia ($700 million), and Canada ($410 million).
APIs: the Supply Side
On the supply side, the global API market is valued at approximately $140 billion, noted Kuhrt, with several industry estimates showing roughly a 60%/40% split between the captive market and the merchant market. Overall, the API market is expected to increase at an annual growth rate of 6.6% and reach $186 billion by 2020, according to information from Persistence Market Research, a New York-based market research firm, with biologics accounting for 30% of the market. In 2016, the merchant API market was approximately 41% of the global API market compared to 60% for captive use, according to Mordor Intelligence, a Hyderabad, India-based market research firm. This level is consistent with levels provided by the Chemical Pharmaceutical generic Association (CPA), which represents Italian manufacturers of APIs and intermediates, in a 2010 analysis. That analysis reported the merchant market at 38.6% and the captive market at 61.4%. Within the merchant market, generics account for between 43.5% (Mordor Intelligence) and 48.7% (CPA).
On a molecule basis, most of the market is still in small molecules although the biologics segment is growing faster, noted Kuhrt. Also, growth in the API market is more on the outsourced or merchant market, with the exception of biologic-based APIs, where there is significant investment by the larger pharmaceutical companies. On the small-molecule side, growth drivers include high-potency active pharmaceutical ingredients (HPAPIs) and cytotoxic small molecules.
In looking at global API production in terms of numbers of producers, local producers, focused on less regulated markets, dominate, they account for 57% of manufacturers, noted Kuhrt. In evaluating API producers, Clarivate uses a scale to indicate where an API producer resides in a spectrum based on a producer’s capacity for producing for regulated markets. The classification ranges from the lowest end of the spectrum “local” (meaning producing for local markets only) all the way to “established” producers for making product for regulated markets and “Big Pharma” companies. In between, there are “potential future” companies with ambitions to enter regulated markets and “less established companies” that have successfully made inroads into heavily regulated markets. Tab. 2 outlines the distribution of global API producers in these categories.
Kuhrt also provided a distribution of API producers on a geographic basis using the headquarters of a given company as the basis for identifying the location of that company. In evaluating the distribution of experienced API producers using that definition, the US leads with the highest number of experienced API producers, accounting for 36% of the global total (tab. 3). In terms of market share, India and China have remained fairly even in terms of number of API producers in 2012 and 2016 while Italy experienced a decline from 2012 and 2016.
In looking at the type of API producers in each of these regions, Western Europe and the US lead with the most experienced API producers. However, it is worth pointing out the significant number of Potential Future companies in India and China (fig. 1).