Overall Equipment Effectiveness (OEE)
The primary goal for any manufacturing or process organization is to produce a profit and return on net asset (RONA) to shareholders and other stakeholders. Safety and environmental performance are secondary goals – not secondary in importance, but no manufacturing plant was ever built with the sole and explicit purpose of being safe and environmentally responsible.
When the organization's production is “sold out,” there is a profit premium on maximizing production throughput. It is important for the organization to "make hay while the sun shines” during these periods of high demand. However, there is also a need to resist the temptation to operate the equipment beyond its design capacity during these times of high demand to avoid excessive stress on the equipment that puts its availability at risk.
Driving business process improvement based upon analysis of overall equipment effectiveness (OEE) offers a tremendous opportunity to achieve your dashboard goals of profit, safety, environmental responsibility and, in many instances, customer satisfaction. The OEE-driven business improvement process described herein offers the flexibility to address any losses, be they supply chain-, operations-, maintenance-, or marketing-induced.
In addition to increasing profits and eliminating the underlying root causes that produce OEE losses, it reduces overall cost of manufacturing, enables the organization to lean out its asset base by reducing or eliminating redundant systems, and lean out production and maintenance inventory levels. The equipment asset base and inventory make up the net operating asset in place (NOAP) – the balance sheet. In basic terms, RONA is the income statement divided balance sheet, so an OEE-focused business improvement process increases RONA both by increasing profit on the income statement and by reducing the NOAP on the balance sheet.
OEE Basics
First coined by Seichi Nakajima, the creator of total productive maintenance (TPM), OEE represents the performance of a manufacturing, process or other industrial organization compared to perfection. The gap is often called “the hidden plant”. OEE is calculated as the product of the availability, rate or speed or performance, and quality. Availability is simply the number of running hours divided by 8,760 – the total number of hours in a year. Rate is calculated as the ratio of the actual production rate divided by the plant’s best sustainable rate. Quality is the ratio of first pass “A-quality” production divided by the total production. OEE performance directly influences revenue by defining the number of production units that are available for sale and less directly as a function of quality. Off-quality production does not fetch as high a price as first-quality goods. In some industries, such as pharma, the disposal of highly controlled unsalable production results in a total loss plus a disposal penalty.
OEE Follows the Money
OEE losses are categorized as planned or unplanned. Planned losses include shutdowns for maintenance, dropping a production shift or reducing the production rate due to slow market conditions. Examples of unplanned OEE losses are lost production time due to a supply chain disruption, equipment breakdowns, etc. OEE losses may be classified as production-, equipment-, and/or market/marketing-induced.
Common production or operations-induced losses include:
- Operational overload
- Incorrect adjustment, recipe, set-up, cleaning, flaring, etc.
- Supply chain disruption – material/energy unavailability
- Supply chain disruption – forced suboptimal product mix
- Supply chain disruption – material quality
- Inefficient production scheduling – excessive changeovers
- Poor changeover efficiency or effectiveness
- Denied access for maintenance and care
Common equipment-induced losses include:
- Incorrect equipment design
- Excessive or insufficient preventive maintenance
- Poorly executed preventive maintenance
- Wrong or insufficient inspections and monitoring
- Ineffective or inefficient work planning
- Poorly executed corrective maintenance
- Maintenance parts quality problems
- Maintenance parts unavailability
Common market/marketing induced losses include:
- Undersold production capacity – suboptimal product mix
- Undersold production capacity – forced line shutdown
- Imposed short runs/frequent changeover
- Oversold production capability
- Undersold production capacity – slow down
- Undersold production capacity – shift loss
Implementing a Business-Focused OEE Loss Recovery Plan
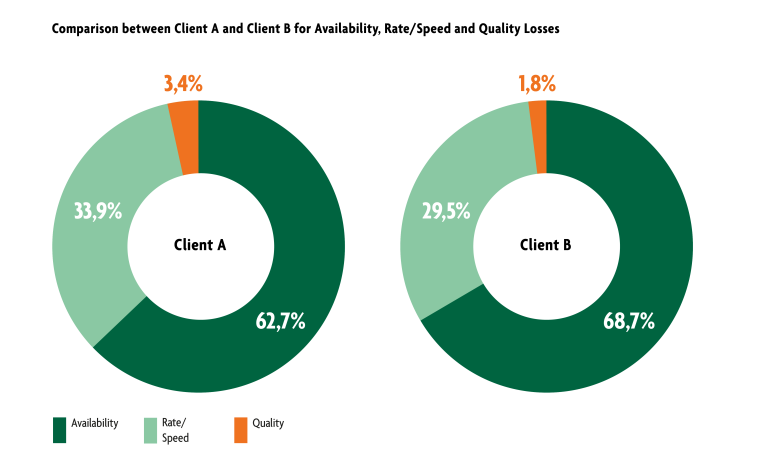
Planned and unplanned losses in production time, rate, and quality erode the plant’s profits and can render it economically unviable. While the word “equipment” is explicitly included in OEE, losses can occur anywhere in the business. It should be renamed overall business effectiveness (OBE). We observed in evaluating the business losses for two different clients, some similar and some very different distributions of losses. Availability accounted for 62.7% of the loss for Client A and 68.7% for Client B. Rate accounted for 33.9% of the loss for Client A and 29.5% for Client B. Quality comprised the remainder of the loss. The loss distribution was very similar for Clients A and B when viewed based upon availability, rate and quality. This is just a coincidence, however (fig. 1).
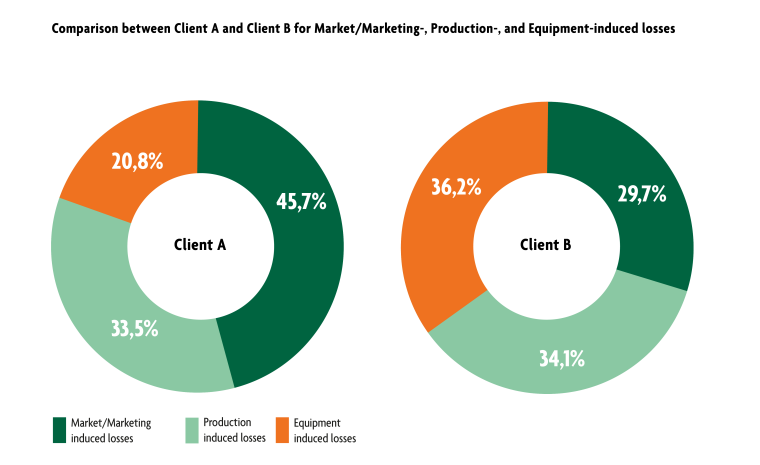
When losses for Clients A and B are compared based upon the business-driver, the story looks very different. Client A attributes only 20.8% of its OEE losses to the Equipment vs. 36.2% for Client B. Client A’s major loss driver is market/marketing-related issues with 45.7% of the total OEE loss, whereas Client B attributes only 29.7% of the OEE loss to market/marketing-induced drivers. Client A and B were relatively similar with respect to production-induced losses with 33.5% and 34.1% respectively. It should be noted that this similarity is only a coincidence. As figure 2 clearly illustrates, if an organization is truly committed to reducing OEE losses, it cannot solely focus on the equipment-induced drivers. It’s also necessary to address all loss categories, including production- and market/marketing-induced loss drivers.
It is incumbent upon managers to aggressively work to prevent or reduce OEE/OBE losses.
As figure 3 illustrates, OEE is the process by which we monitor and track availability, rate, and/ or quality losses utilizing an enterprise asset management (EAM) system. Once a loss or opportunity is found, it is necessary to understand the underlying business process that is flawed and requires reengineering. If the process that is producing loss is stable, we transition to the defect elimination process utilizing root cause analysis (RCA), human factors analysis (HFA), engineering analysis etc. to gain a better understanding about the mechanisms and underlying causes of the business process performance deficiencies.
If the loss-producing process is unstable, then we must determine if the instability is systemic. If it is, it is advisable to perform what is called success root cause analysis (SRCA). If we can understand how and why a process is stable, we can standardize the successful scenarios. If it is not systemic, then we loop back to conventional defect elimination.
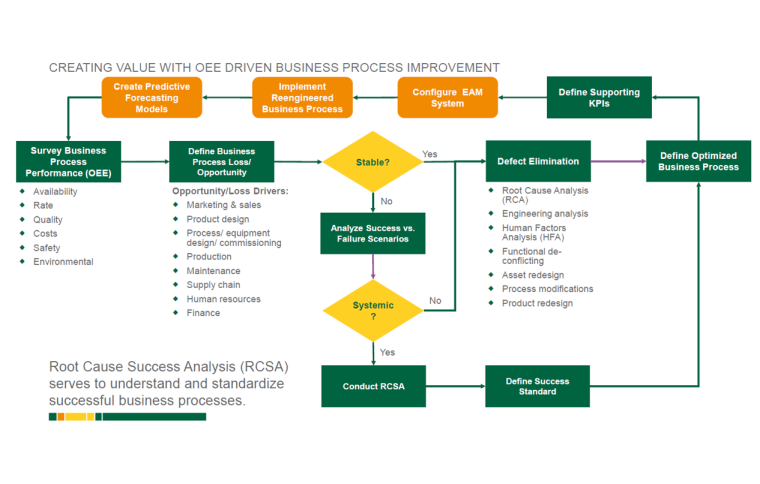
In all cases, the information gained in the process is employed to reengineer and define optimized business processes that are optimized relative to the organization’s dashboard goals – usually centered around profit, safety, customer satisfaction, and environmental sustainability. It is necessary to define key performance indicators (KPIs) that will support the reengineered business process and incorporate them into the organization’s EAM system, which closes the process loop back at survey business process performance.
Once the business processes are reengineered and optimized, the arduous work of guiding the organizational change management process begins. This part cannot be approached casually. Most people and organizations are susceptible to “psychological inertia” – people and groups of people tend to continue to do what they have always done. You will need a solid organizational change management plan to implement OEE-driven business process reengineering and improvement.
Many EAM initiatives are focused on information technology (IT) or finance. While the EAM system is employed in our business-centered approach, it is not central. People and processes are central to our OEE-driven, business centered approach, which includes:
- Business-driven with the intent to support effective business decisions that create value, recover losses, and manage risks
- Focus is supporting people, processes, and value creation
- Operations & maintenance (O&M), supply chain, risk managers, etc. are central to creating a fit for purpose EAM solution
- Our need-driven EAM solution is configured to support business processes
- The product converts data into information that supports effective decisions and actions
Most importantly, leaders and managers are actively involved in the change and are informed and effective as a result.
Conclusion
Overall equipment effectiveness (OEE) enables us to analyze and classify performance gaps and attach the associated losses to sub-standard and unoptimized business processes across all functions of the organization. The analysis requires a properly configured enterprise asset management (EAM) system and associated key performance indicators (KPIs). Further, business process improvement requires solid analytical capability and a great plan for organizational change management – the most difficult challenge.
Authors: Drew Troyer, CRE, Management Consulting Principal Director; Bernd Zanger, Management Consulting Principal Director; and Andrew Callen, Management Consulting Principal Director, T.A. Cook – Part of Accenture


Company
TAC Insights GmbHHardenbergstraße 32
10623 Berlin
Germany


most read

20 Years of CHEManager International
Incredible but true: CHEManager International is celebrating its 20th anniversary!

ISPE Good Practice Guide: Validation 4.0
The Validation 4.0 Guide provides a comprehensive approach to ensuring product quality and patient safety throughout a pharmaceutical product's lifecycle.

Pharma 4.0 – the Key Enabler for Successful Digital Transformation in Pharma
Part 1: Building a Business Case for Pharma 4.0

US Tariffs Fatal for European Pharma
Trump's tariff policy is a considerable burden and a break with previous practice.

Pharma 4.0—the Key Enabler for Successful Digital Transformation in Pharma
Part 3: Seven Theses for successful Digitalization in Pharma