Innovation Makes A Difference
Europe’s Chemical Sector Seeks Competitive Edge to Withstand Challenges by Global Demand and US Competition
-
 (c) Andres Garcia Martin/Getty Images
 -
 Marc Livinec, Euler Hermes Group
 -
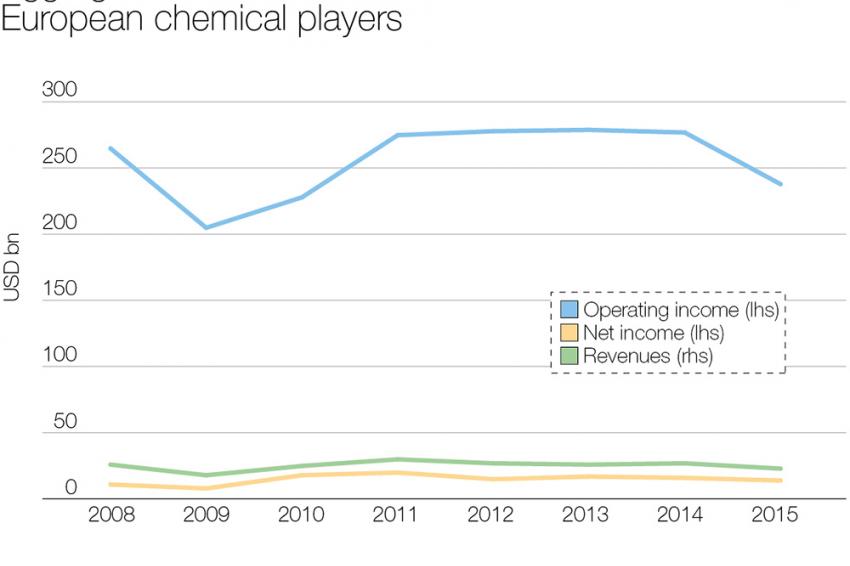 Figure 1
 -
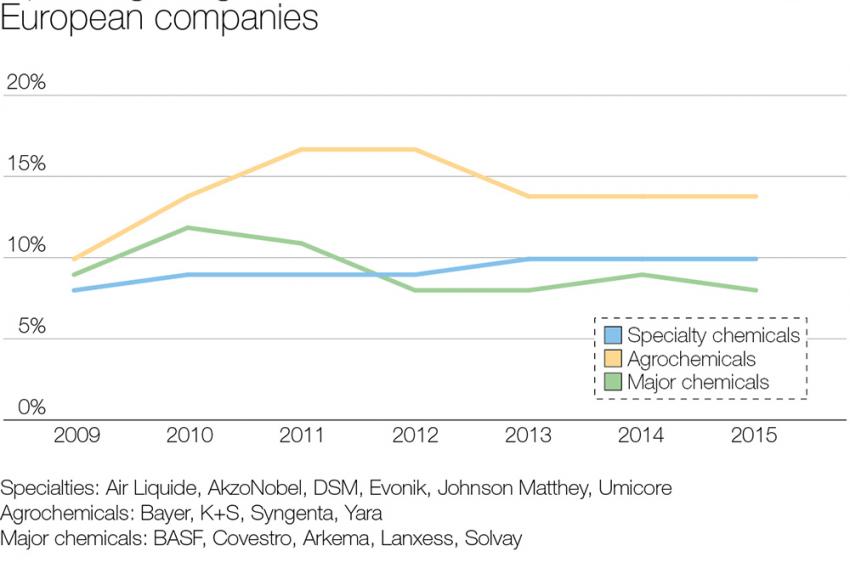 Figure 2
 -
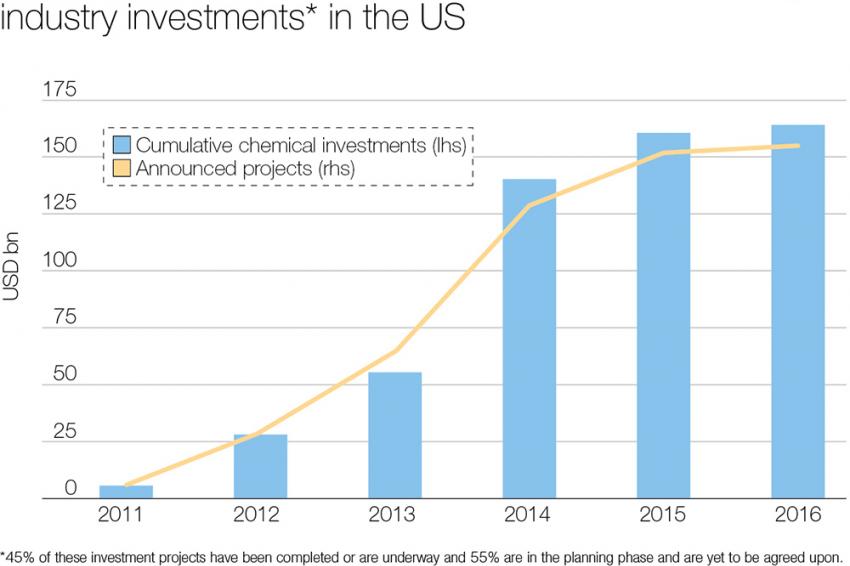 Figure 3
The biggest – listed – European chemical manufacturers (Air Liquide, Akzo Nobel, Arkema, BASF, Bayer, Covestro, DSM, Evonik, Johnson Matthey, K+S, Lanxess, Solvay, Syngenta, Umicore, and Yara) have posted an operating margin rate around 10% on average between 2010 and 2015. Overall operating margins slowly decreased from $30 billion in 2011 to less than $ 23 billion in 2015. Yet revenues remained stable at around $276 billion (2011-2014) before a -15% drop in 2015 to $238 billion (Fig. 1). We expect a healthy operating margin rate in 2016 despite flat – or even declining – revenues.
The aggregated net profitability is on a similar trend although overall figures are smaller (around $14 billion in 2015). This reflects a net margin rate of 5% on average over the 2010-2015 period, a good-enough performance compared to other sectors.
The spread between the operating and net incomes stems from restructuring and divestment costs since the 2009 slump. Yet a cycle peak between 2005 and 2007 made it resilient enough to cope with the drop in net profitability.
At the same time, the sector refocused on core activities, where it enjoys a solid competitive edge. These usually relate to specialized sub sectors, where innovation makes a bigger difference than raw material costs.
This explains the “low” or “medium” risk rating attributed by Euler Hermes to almost all chemical industries in Western Europe – Greece being the only exception.
The Asian Challenge: a Specialized European Response
Specialty segments have become the main drivers of overall performance and compete more successfully on a global scale. Both major chemical and agrochemical players still play an important role (see fig. 2).
Specialized chemical companies generate the highest added value. A decade ago, many Western European upstream chemical companies faced a critical challenge from Asian producers. The Europeans opted to move forward and down the value chain. This strategy has eased the dependence on volatile raw materials’ prices. It also helped to focus on advanced technological products which deliver higher margins, such as consumer chemicals, which are used in final products in the hygiene and cosmetics industries.
The operating margin rate in the specialties subsector has gradually gone up to 10% since 2008 and leveled off since last year. A plunge in 2012 stemmed from a €2.5 billion write-down in Akzo Nobel’s decorative paints business.
Specialty chemicals are all about margin rather than volumes. However, if a large outlet – such as construction – loses steam, suppliers’ profitability suffers. Write-downs on capital-intensive plants are to blame.
Despite their size, major European chemical players are not immune to slowdowns. Giant companies’ operating margin rates have fallen from 12% in 2007 to 8% in 2013 before leveling off at around 8% in 2015.
Although big companies benefit from a broad and diversified customer base, they are pushed to write-off hefty production costs and margins may be hit. As a result, big chemical players are under constant reorganization.
European agrochemical producers have maintained high operating margins (above 13%) even if revenues are on a downward trend. Companies in this sub-sector have been able to weather the difficulties in its main outlet – the farming sector – despite the latter has been plagued by low prices of agricultural commodities such as wheat, corn, and meat.
These companies’ biggest advantage is their reign over an oligopolistic market. A strong negotiating position might translate into dictating prices. The Competition Council mulls this issue as it considers a possible merger between the agricultural supplies behemoth Bayer and US giant Monsanto, the world’s biggest seed company.
The global landscape is becoming ever more complex and competitive. The European market accounts for 17% of world sales, around one point more than North America. Asia leads the pack with 58% market share, of which 34% is generated by China alone mainly positioned in chemicals upstream. Europe’s chemical players have relied on a resilient regional economy.
The $680 billion market in the western part of the continent is well-diversified with six significant sub-segments. Two main ranges of activities are critical.
Specialties’ – the most value-added chemical sub-segment – generates 29% of turnover.
Even bigger still, plastics (petrochemicals incl.) accounts for 46% of regional turnover, with ethylene (26%) and polymers (20%) as main products. In this segment, volumes tend to play a more dominant role than values, because upstream activities are less value-added than downstream ones.
Extra-EU income accounts for 25% of European companies revenues. In other words, most exports remain within the European Union. Specialty chemicals account for 35% of total exports. Along with consumer chemicals, the two sub-segments account for the bulk of the EU chemicals trade surplus.
Petrochemicals, on the other hand, face an uphill battle against upstream North American competitors which capitalize on their cheap shale gas price and both of them against Asian competitors at the same time.
Cheap Feedstock Bonanza and the American Challenge
Ethylene is the chemical industry’s key product. It is utilized as the basic building block in the production of a wide range of plastics, solvents, and cosmetics.
Because of its position at the core of petrochemicals and plastics’ production processes, this olefin accounts for 46% of chemical sales worldwide. Global production of ethylene reached 140 million t in 2015, up 3.5% compared to 2014 due to new Chinese capacities.
As ethylene’s manufacturing process requires the use of fossil fuels as raw materials, its production price is highly dependent on fluctuations in feedstock prices.
A critical divergence comes into play here: European companies tend to utilize naphtha, which is manufactured out of crude oil, as their primary feedstock. American production is mostly ethane-based and thus impacted by the price of natural gas.
Since the beginning of the decade, the US shale revolution ushered in a tectonic shift in North American gas prices. These were twice as low as in Europe and three times lower than in Asia. Feedstock costs in the US have plummeted and American (petro)chemical companies enjoyed a significant advantage and growing market share gains.
On the other side of the ocean, European petrochemical players suffered. Things changed with the collapse in the price of oil, and consequently naphtha, providing the Europeans with a much needed reprieve.
In the period between 2011 and 2013 the spread in Ethylene’s prices between North America and Europe exceeded $600. Since 2014, it was halved and now stands at less than $300.
When compared to feedstock costs, ethylene selling prices make it possible to calculate an approximate gross margin in the petrochemical sector across the main three regions.
The US chemical sector enjoyed a clear edge for three years (2010-2013). Yet the gap has closed.
Ever since 2014 European and Asian chemical players’ position has improved. As we expect oil and (therefore) naphtha prices to stay low until at least 2017, this trend should hold.
Ethane Has Been Given Preference by the US
However, the US has another important advantage: a gap in production costs of naphtha and ethane. Disruptive fracking technology has been massively used to produce gas and oil at a very competitive cost.
As American shale gas technology had been developed four years earlier than shale oil, the US gas price was cheaper than the oil price for a long period.
No wonder the US (petro)chemical sector has turned its attention to ethane as a feedstock rather than naphtha.
Ethane price fell by -67% between 2009 and 2012 while naphtha soared by +30%. Between 2012 and 2015, US naphtha price fell by -60% while the US ethane price dropped by further -40%.
Price Competitiveness of US Upstream Chemical Companies
The US chemical sector gained an edge on foreign competitors for a while thanks to lower feedstock costs and the ethane windfall. Moreover, the US cashed in on a strong rise in cars sales, a steady pick-up in consumer spending, and a rebound in housing activity.
In the longer term, investment could be a definitive factor. American players have recently spent heavily on downstream ethylene steam-crackers, which cost more than $1 billion each.
In most cases, five years pass from the moment an investment decision is taken until the new plant begins operations.
Thus US competition in upstream chemicals should surge at the beginning of next decade. Figure 3 presents cumulative investment projects in the US chemical industry. $90 billion worth of new capital investment should be operational by 2021.
The Global and Regional Demand Challenge
Weak demand will keep weighing on overall output growth, which should edge up by +1.1% in 2017 after 1.3% in 2016. The soft-paced European recovery, sluggish global trade and farming sector woes which has just begun impacting the agrochemical (sub)sector, might make a deeper dent than expected.
We forecast that the growth rate of chemical output in Europe should amount to no more than +1.1% in 2017. Main chemical producing countries across Europe will continue to feel the pressure on selling prices.
Even if the European chemical sector has proven resilient for four years, its production growth rate depends strongly on the health of its main industrial outlets. Taken together, the first three of these – construction, automotive and electronics – usually account for a third of total chemical sales. A downward trend in any of the three means that chemicals would feel the pinch. For example, construction across Europe went through some difficulties in 2012.
So did chemical production with a -1.6% drop in production on a yearly average at that time. Thus the chemical sector is not immune to external shocks dealing with its main outlets. From a more domestic point of view, growth trends should remain positive although uneven in 2017.
Germany will take the lead (+1.5% in 2017) while the UK should soften and lag behind (+0.3%) despite a more favorable pound exchange rate because of the Brexit fallout.
French chemical players can still count on the good health of two important outlets – construction and automotive – and on the leadership of L’Oreal in hygiene/cosmetics.
Belgium has been falling behind with a -11% chemical output between 2012 and 2016 despite the buyout of Rhodia by Solvay in 2011.