A Place To Thrive
Industrial Parks’ Benchmarking of Infrastructures and Services Part 2: Energy, Utility and Traffic Infrastructures
-
 Panoramafoto Infraserv
 -
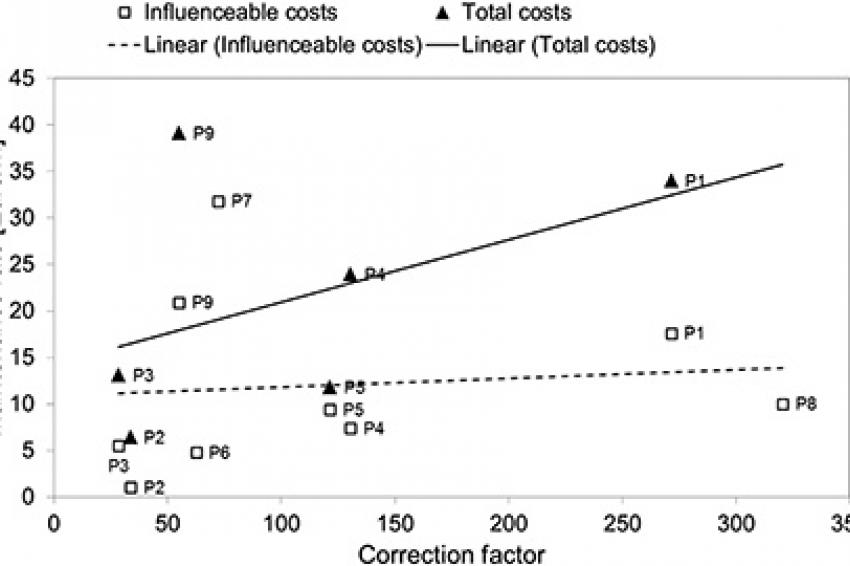 Figure 1
 -
 Figure 2
 -
 Figure 3
Monitoring Maintenance - Based on a benchmarking study with nine chemical parks and chemical-related industrial parks in Germany described in part 1 of this series, part 2 describes maintenance of electric energy and utility infrastructures (steam, compressed air, industrial water, drinking water) and traffic infrastructures.
Electric Energy Infrastructures
Only maintenance costs for the distribution of electric energy and not those for the production were investigated, i.e., only maintenance of the grid and not of the power plants. All participants had the three voltage levels 110 kV, 30/25/20 kV and 6/5 kV in their electrical networks. To determine the maintenance rates of the electrical network, the maintenance costs in relation to the length of the network were taken.
The maintenance rates ranged from €1 to €40 per meter. Figure 1 (P1 to P9 stands for the different participants of the benchmarking study) shows the correction factors as horizontal axis and the key performance indicator maintenance rate as vertical axis. The regression line increased slightly with the correction factor, which was expected, as the correction factor stands for the complexity of the networks, and the increasing maintenance rates should correlate with increasing complexity.
The cost-saving potential was up to €5 per meter. Costs could be saved, for example, through an extension of the revision cycles of the electric energy networks. For transformers, most participants chose five years for revision cycles, but there were also significantly shorter and longer revision cycles. While most participants normally conduct the revisions annually, the revision cycle for transformers was extended to 10 years at one park. The revision cycles for switch bays were between four years and 10 years and for protective relays between one year and 6 years. The differences could be explained by the participants' historically different levels of experience with maintenance.
Utility Infrastructures
With high, medium and low pressure, the participants had three different steam-pressure levels. The range of maintenance rates of steam networks in relation to the length of the network was up to €28 per meter (Figure 2). The cost-saving potential was up to €5 per meter.
Cost savings are possible through condition-oriented maintenance, e.g., for pumps, generators and compressors, which enables early detection of failures as well as implementation of equipment-specific key figures (e.g., mean time between failures, mean time to repair). The maintenance rates for the production and distribution of compressed air were up to €39 per meter (Figure 3), and the cost-saving potential for maintenance was up to €15 per meter.
The maintenance costs for industrial water based on length were between €4 and €63 per meter. The cost-saving potential for maintenance costs was up to €5 per meter. Cost-saving potentials can be realized by the reduction of network losses. Within a continual optimization of water networks, some of the participants had systematically set up a network of water meters, which had led to an improvement of the identification of weak spots and leakages.
For drinking water, based on length, the maintenance rates were up to €43 per meter based on total costs. The cost-saving potential for maintenance with the correction factor was up to €8 per meter.
Traffic Infrastructures
Various key performance figures for roads were defined, such as maintenance rates based on the size of area of the roads and in relation to the replacement value. The maintenance rates for roads based on area are up to €5 per square meter and based on replacement values up to 0.1%. The road-management costs - costs mainly for the road managers to observe the road conditions and to manage maintenance activities - are between €6,000 and €40,000. The specific management costs as key performance indicator for roads based on area are up to €0.28 per square meter and the cost-saving potentials around €0.1 per square meter - or in absolute numbers €15,000 per year. For street lighting, the maintenance rates based on the number of lights are up to €100 and the maintenance rates based on the size of road up to €0.4.
Conclusions of Parts 1 and 2
The benchmarking results showed large differences in performance levels, indicating there are still significant cost-saving potentials. Each industrial park should understand the individual performance level and adapt best practices in all areas. The performance level makes a clear difference between high-performance industrial sites and sites that have to be more consequent in their restructuring and cost-saving efforts.
The benchmarking, using the correction factors, enabled the comparison of different infrastructures and made possible a discussion based on comparable and comprehensible figures. The correction factors, which have to be very specifically defined for each area, increase the acceptance and applicability of the benchmarking methodology. The correction factors used in this study worked well in the majority of cases and could also be used in other studies or function as a starting point for a discussion to customize them more to special needs.
Some values of key performance indicators were below the regression line, which means the key performance indicators are below best practice. These "negative" cost-saving potentials gave, in some cases, clear indications that the maintenance level was too low with negative consequences for the long-term competitiveness of the infrastructure. A conclusion is that not the lowest maintenance level but rather the optimal maintenance level should be the aim of best-practice and performance-improvement initiatives. This rather simple insight is sometimes lost, especially within top management, which leads to unrealistic and long-term, even counterproductive, cost-saving targets.
Part 1 of this article series described key performance indicators and cost-saving potentials of building infrastructures, for fire brigades and security services. The details of the benchmarking study can be found in scientific publications, for instance: G. Festel, M. Würmseher, Challenges and strategies for chemical/industrial parks in Europe, Journal of Business Chemistry, Vol. 10, No. 2, June 2013, pages 59-66.
Contact
Festal Capital
Mettlenstr. 14
6363 Füringen
Switzerland
+41 41 7801643
+41 41 7801643